Reading
Your Reports
Once a few orders have rolled in, the Reports tab turns them into numbers you can act on — what you actually earned, what's still on the road, who keeps coming back, and when the day gets busy. This guide walks through every screen.
- 1. Open Reports & pick a date range
- 2. The Reports overview
- 3. Profit & loss
- 4. Cashflow — money on the road
- 5. Payments — COD vs prepaid
- 6. Delivery scorecard
- 7. Customers & cohorts
- 8. Discounts & returns
- 9. Hourly heatmap
Open Reports & pick a date range
Tap the Report tab at the bottom. The first thing to notice is the small date chip at the very top — something like Last 30 days with a calendar icon. Every number on every report screen is filtered by that range. Change it once and the whole report — overview, profit, cashflow, everything — refreshes to match.
Tap the chip to open the range picker. You can pick a preset:
- Today / Yesterday — quick check on what just happened.
- Last 7 days / Last 30 days / Last 90 days — rolling windows for trend.
- Month-to-date / Last month — month-aligned totals, useful for closing the books.
Need something else? Switch to the Custom tab and pick your own start and end date.
On any report screen, pull down to refresh if you've just saved an order in another tab and want the numbers to catch up immediately.
Tip: The range you pick is shared across every report screen — open Profit & loss, change the range, then jump to Cashflow and you'll see the same window applied.
 The date range chip sits at the top of every report
The Reports overview
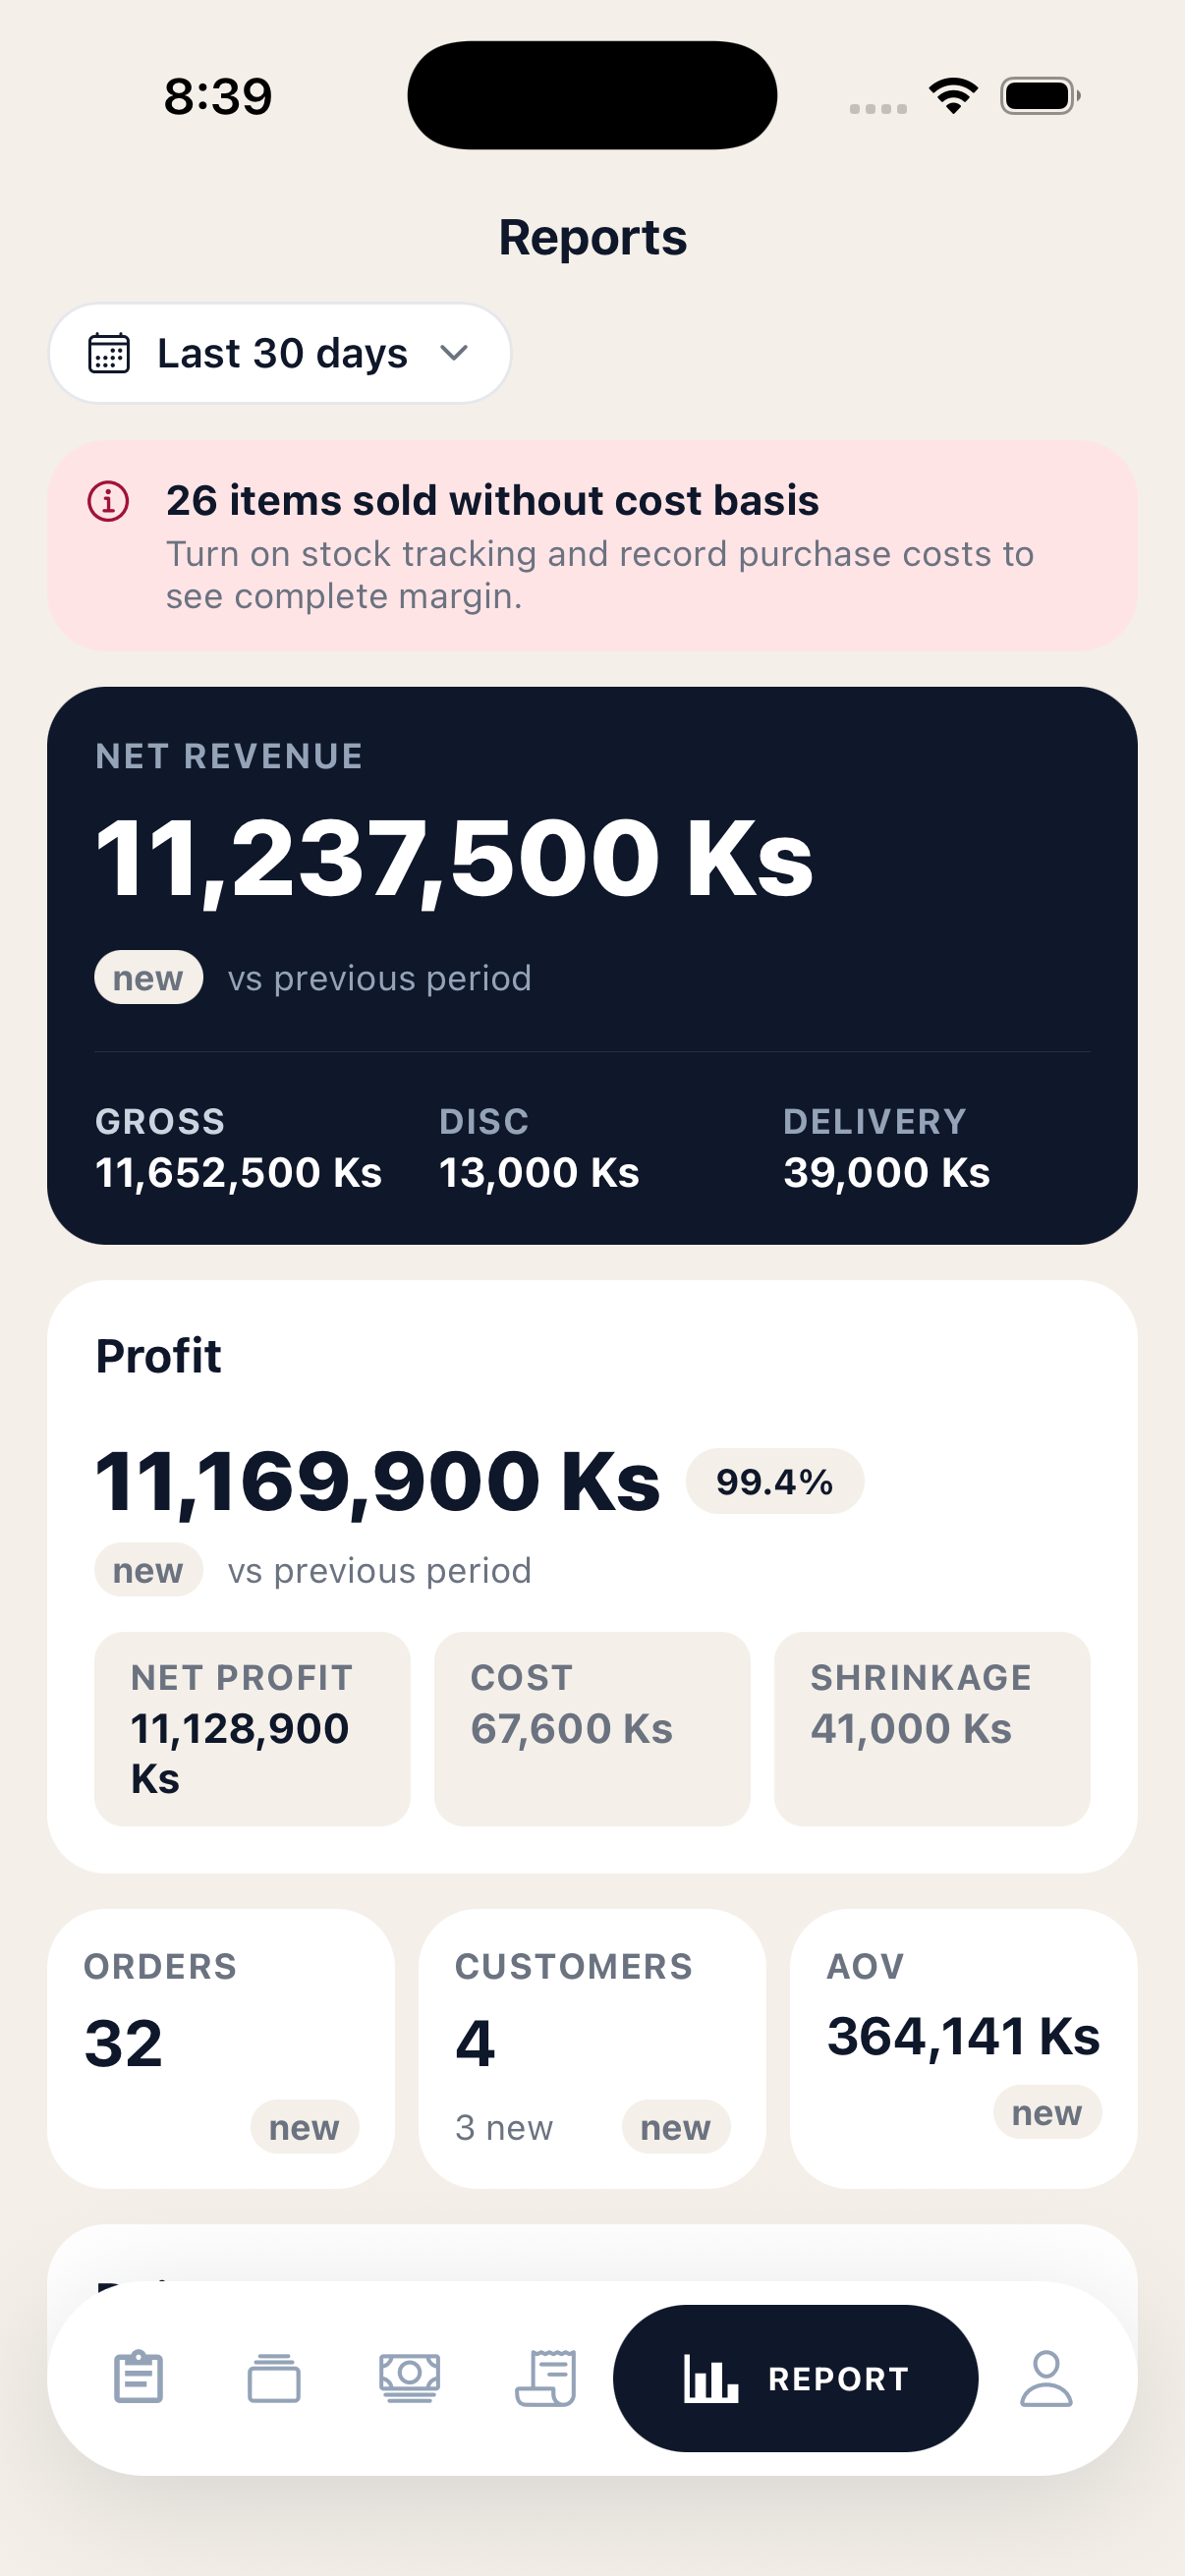
The home screen of the Reports tab is a one-page snapshot. Read it top to bottom and you'll know — in under a minute — how the chosen range is going.
The main cards, in order:
- Net revenue (the dark hero card) — what you actually earned after discounts. The small vs previous period pill compares this range against the same length of time before it (last 30 days vs the 30 days before that).
- Profit — your gross profit, plus a margin chip and a tile breakdown of net profit, cost of goods, shrinkage. Margin is always shown so you can spot a busy month that wasn't actually profitable.
- Orders / Customers / AOV — three quick tiles. Each shows the count or amount, plus how it changed vs the previous period.
- Daily sales — a simple bar chart, one bar per day. Tap a bar to see the date, revenue, and order count.
- Order status — a coloured bar showing how this range's orders split between Delivered, Shipping and New.
- Cash in transit — money that's on the road or unpaid. Tap it to jump straight into the full Cashflow report.
- Top products & Top customers — the leaders for the chosen range, with revenue, profit and margin where available.
- Explore — a grid of cards at the bottom that opens each detailed report (Profit & loss, Hourly, Payments, Delivery, Cashflow, Customers, Discounts, Returns).
Heads-up: If you see a pink banner at the top saying "X items sold without cost basis", it means some sold products didn't have a purchase price recorded. Profit and margin will be a little optimistic until you fix those — open the product, record a restock with the price you paid, and the next refresh will heal the math.
Reports overview — your one-page snapshot
Profit & loss
The Profit & loss screen is your full income statement for the range. The hero shows net profit with a margin chip, then a clean breakdown walks every line from gross revenue down to the bottom line:
- Gross revenue — everything customers were charged.
- − Returns — money taken back when an order came back.
- = Net revenue — what actually stayed.
- − Cost of goods sold — what you originally paid for the items that were sold.
- = Gross profit (with margin %) — the spread between price and cost.
- − Operating expenses — anything you logged in the Expenses screen.
- = Operating profit — profit after running costs.
- − Shrinkage — stock you wrote off as lost, damaged, expired, etc.
- = Net profit (with net margin %) — the final, takeaway number.
Below the breakdown sits an Inventory cash flow card — the difference between what you spent restocking this period and what you recognised as cost of goods sold. A footnote tells you whether your shelf grew, drew down, or stayed flat in cash terms.
Then a daily revenue bar chart (tap a bar for the day's net P/L), a per-product profit table, a shrinkage breakdown by reason, and your expenses grouped by category.
If you see a pink "stock lots without purchase price" banner, those lots are dragging down your COGS accuracy. The banner tells you exactly how many lots and how many sold items are affected — fix the upstream lots and the whole P&L heals on the next refresh.
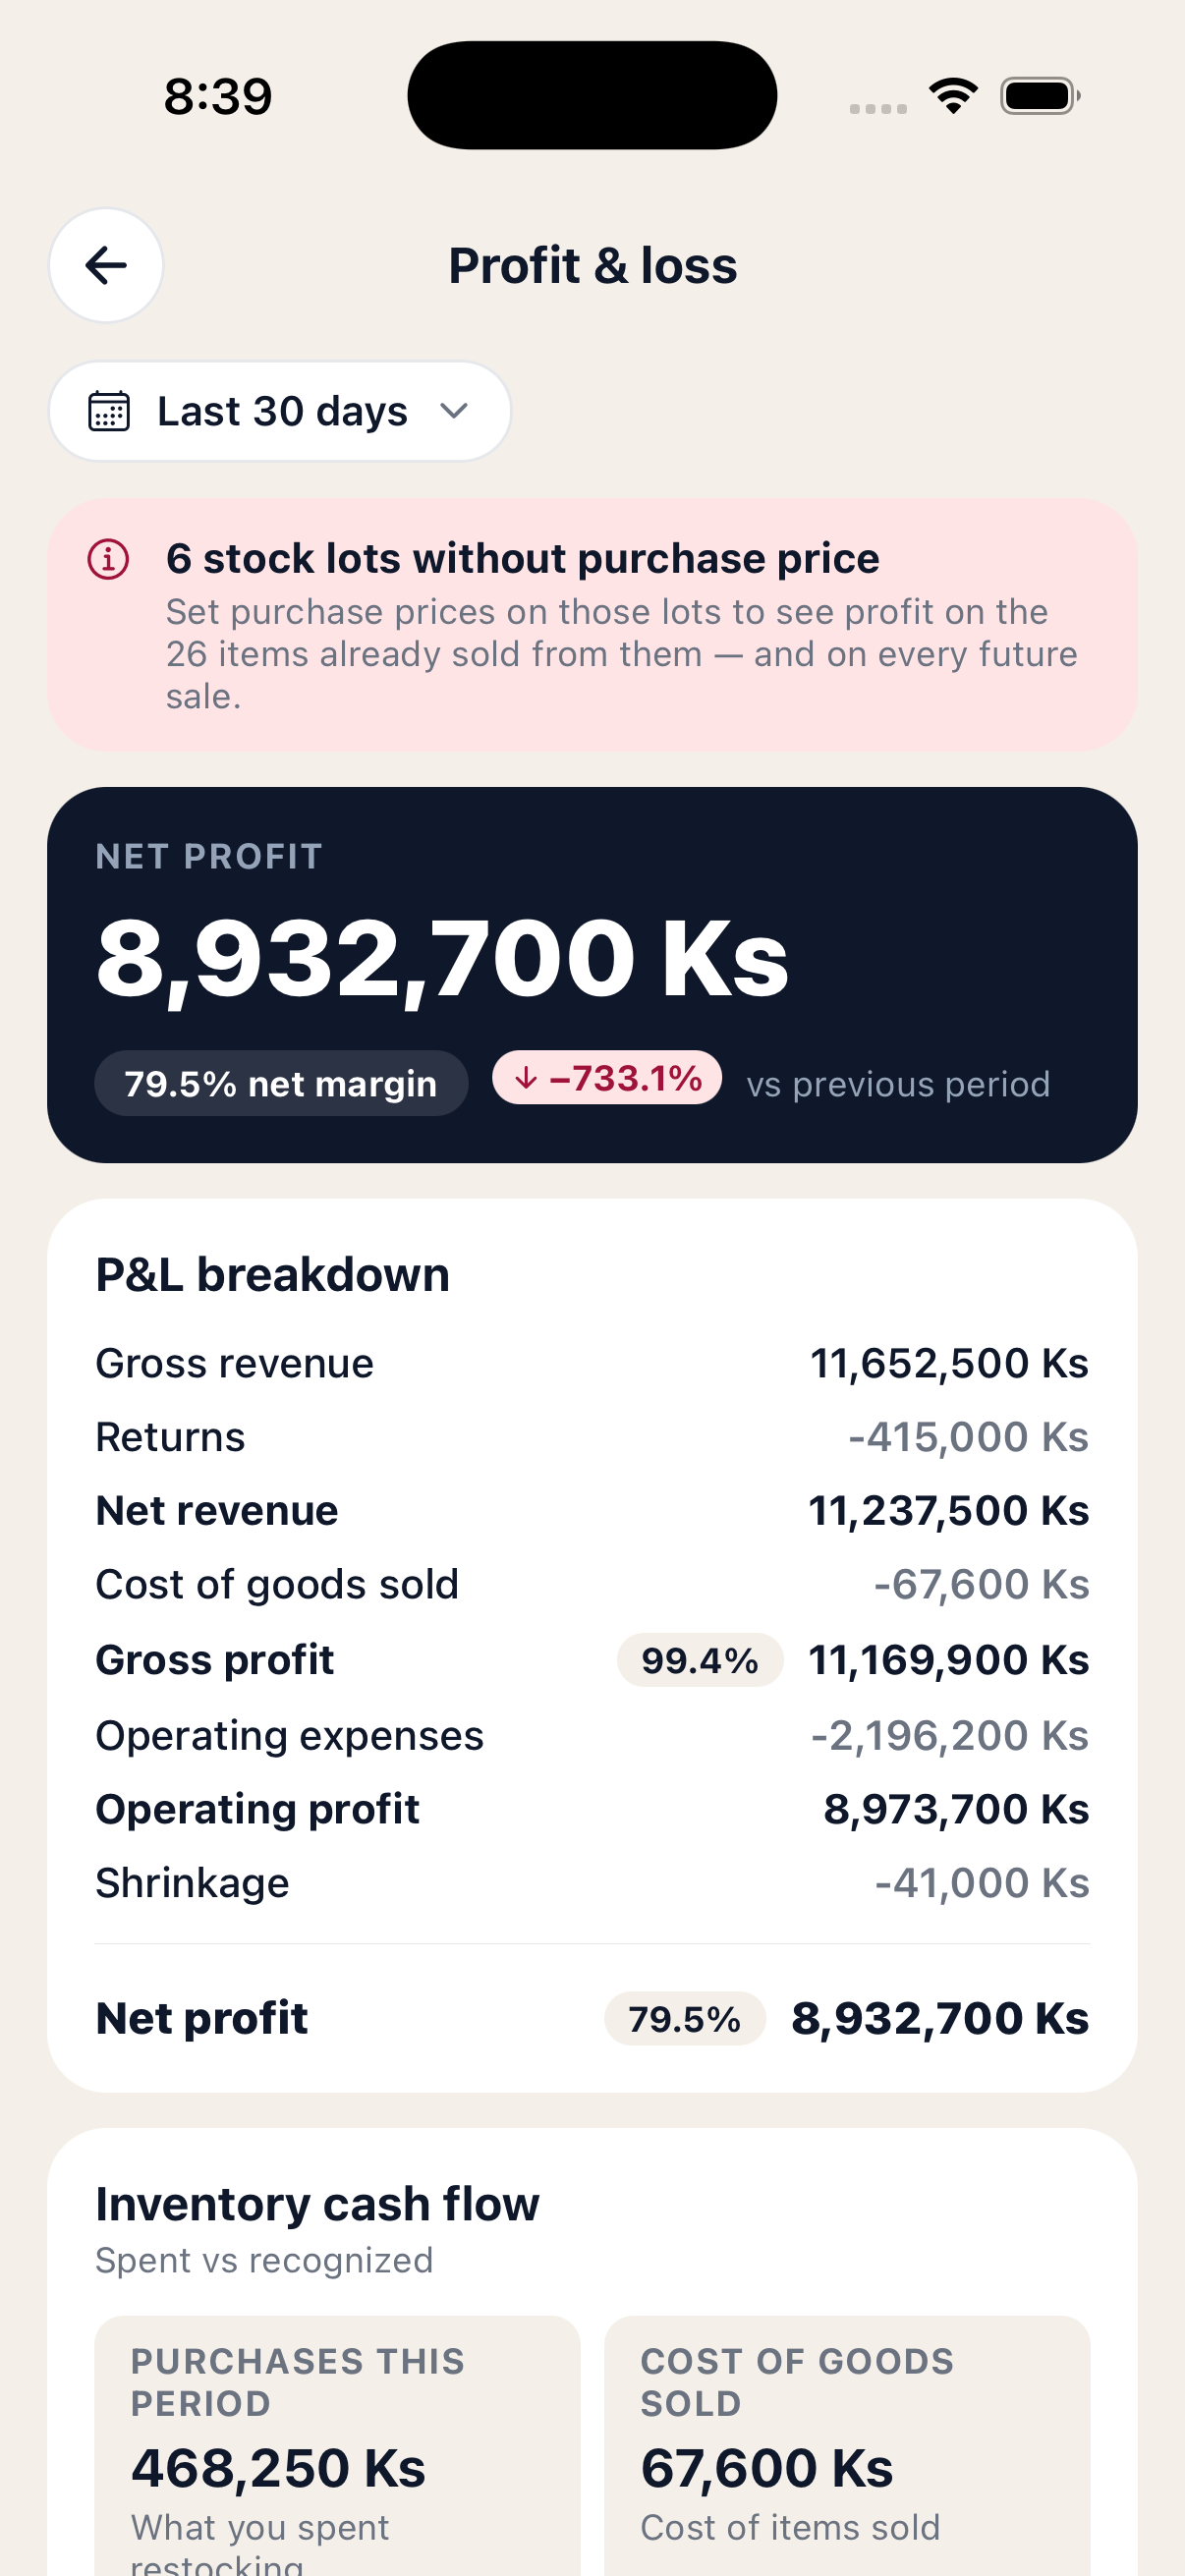 P&L breakdown — every line from revenue to net profit
Cashflow — money on the road
The Cashflow screen answers one question: how much money is owed to me right now, and how worried should I be about it?
The dark hero card at the top shows Outstanding — the total kyat across every order that's been delivered but not yet paid out, or shipped but not yet collected. Below it sits the order count and an as of timestamp.
The By age card splits that outstanding pile into four buckets:
- 0–3 days — fresh, no action needed.
- 4–7 days — normal courier turnaround.
- 8–14 days — worth chasing.
- 15+ days — call the courier today; this is at risk.
The next card breaks the same outstanding total down by delivery service — useful for spotting a courier that's slow to settle.
At the bottom, two tiles — Settled in range and Returned in range — show how much money actually came in (or had to be refunded) during the chosen window.
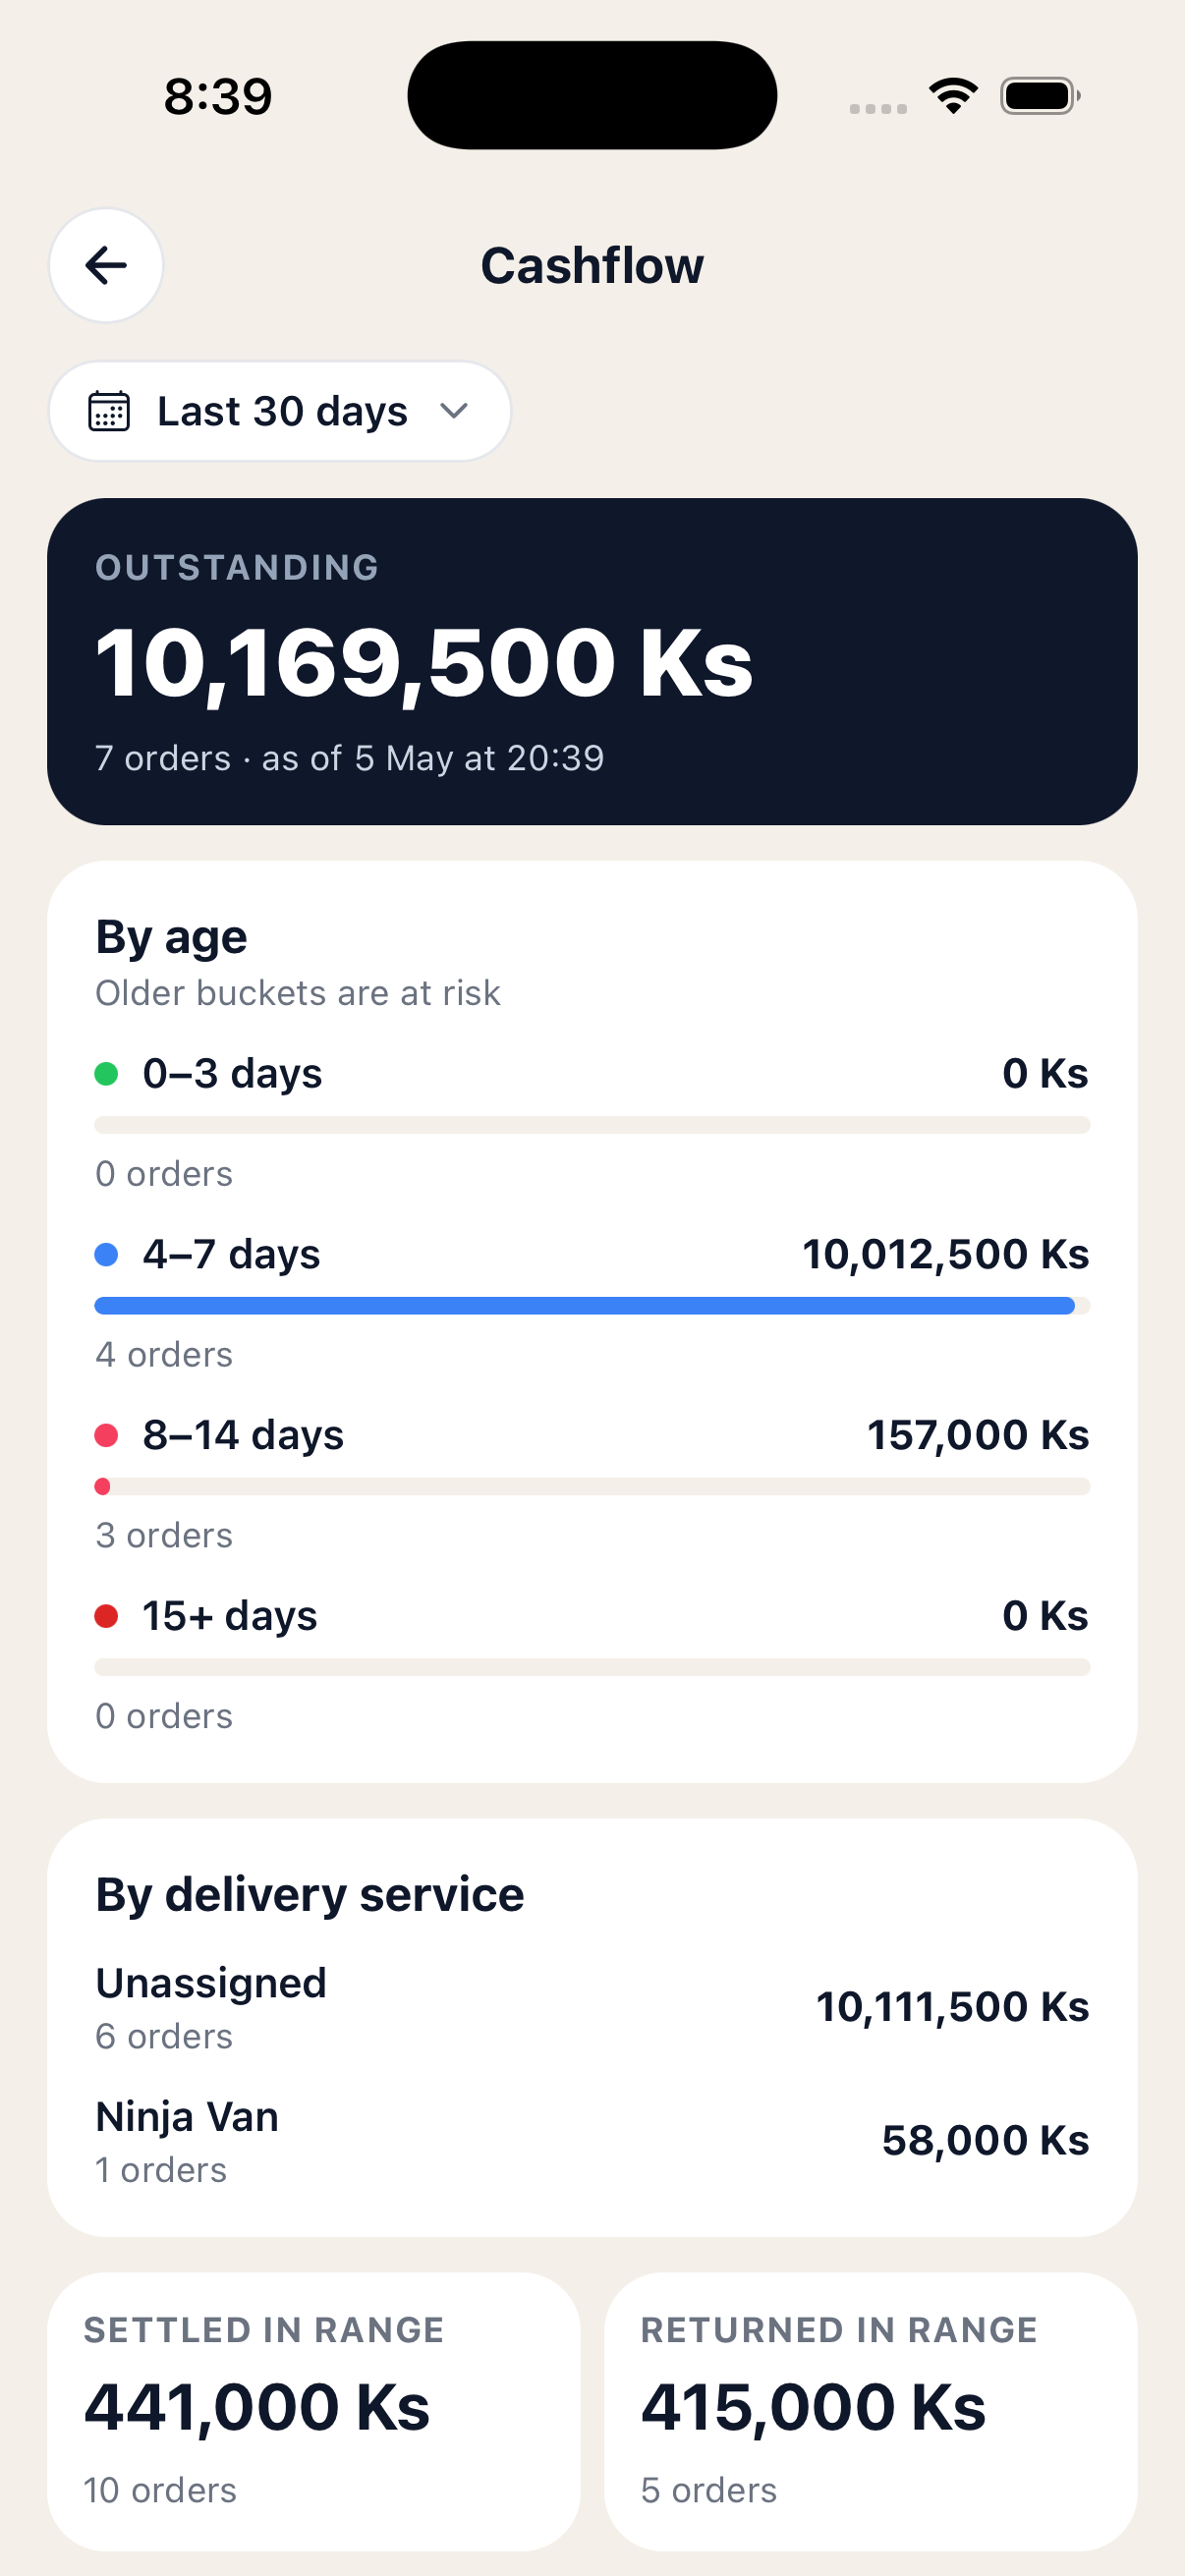 Outstanding cash, split by age and courier
Payments — COD vs prepaid
The Payments screen tells you how you're being paid.
The first card — COD vs prepaid — is a single coloured bar. Green for prepaid, red for cash on delivery. Below it, a legend shows the order count, revenue, and share for each.
Next is the Pipeline — payment state as of today, in four cells:
- Pending — orders that haven't been paid yet.
- Collected — courier has the cash but hasn't paid you out.
- Settled — the money has reached you.
- Returned — the order came back and the money never converted.
Below that, the By channel card lists every payment channel you've used (KBZ Pay, AYA Bank, cash, etc.) plus an Unassigned bucket for COD that hasn't been routed yet. Each channel shows revenue, order count, AOV, share, settle speed and return rate — so you can see at a glance which channels are fast and clean and which ones cost you returns.
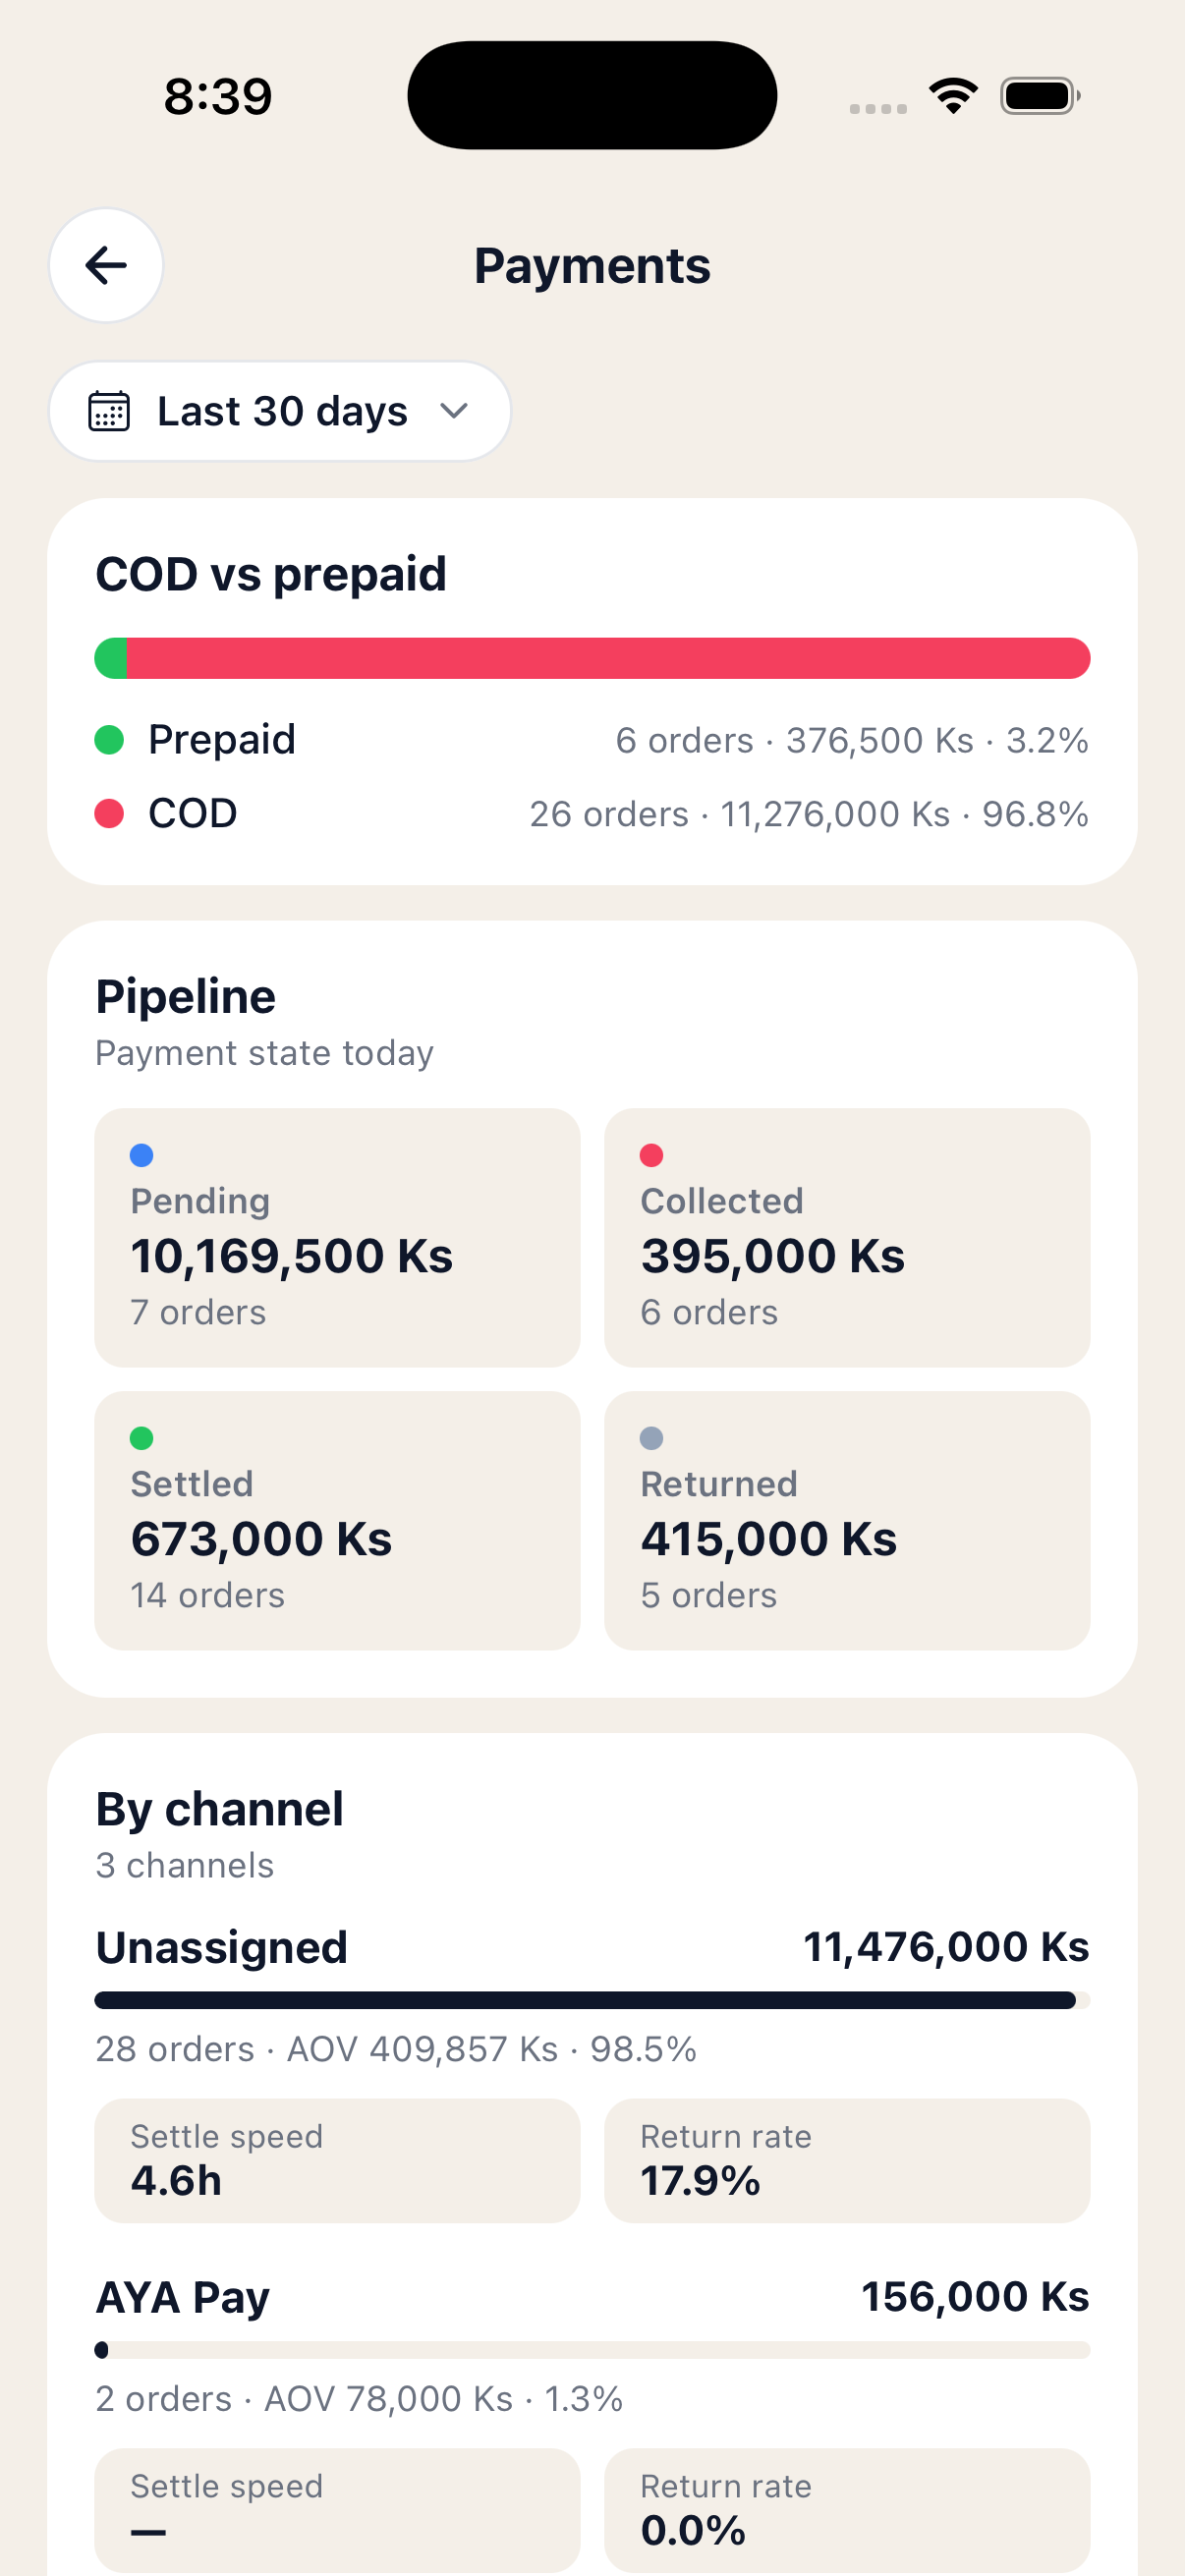 Payment mix, pipeline and per-channel performance
Delivery scorecard
The Delivery screen is a one-card-per-courier scorecard. Each card shows the courier's name, how many orders went through them in the range, and a coloured on-time badge — green at 90%+, amber 70–89%, red below.
Inside each card, four stats:
- Delivery time — average hours from "shipped" to "delivered".
- Return rate — share of their orders that came back.
- Settle lag — average hours from "collected cash" to "paid you out".
- Outstanding — kyat they're still holding.
Use this when you're choosing a default courier, or having a tough conversation about why payouts are slow.
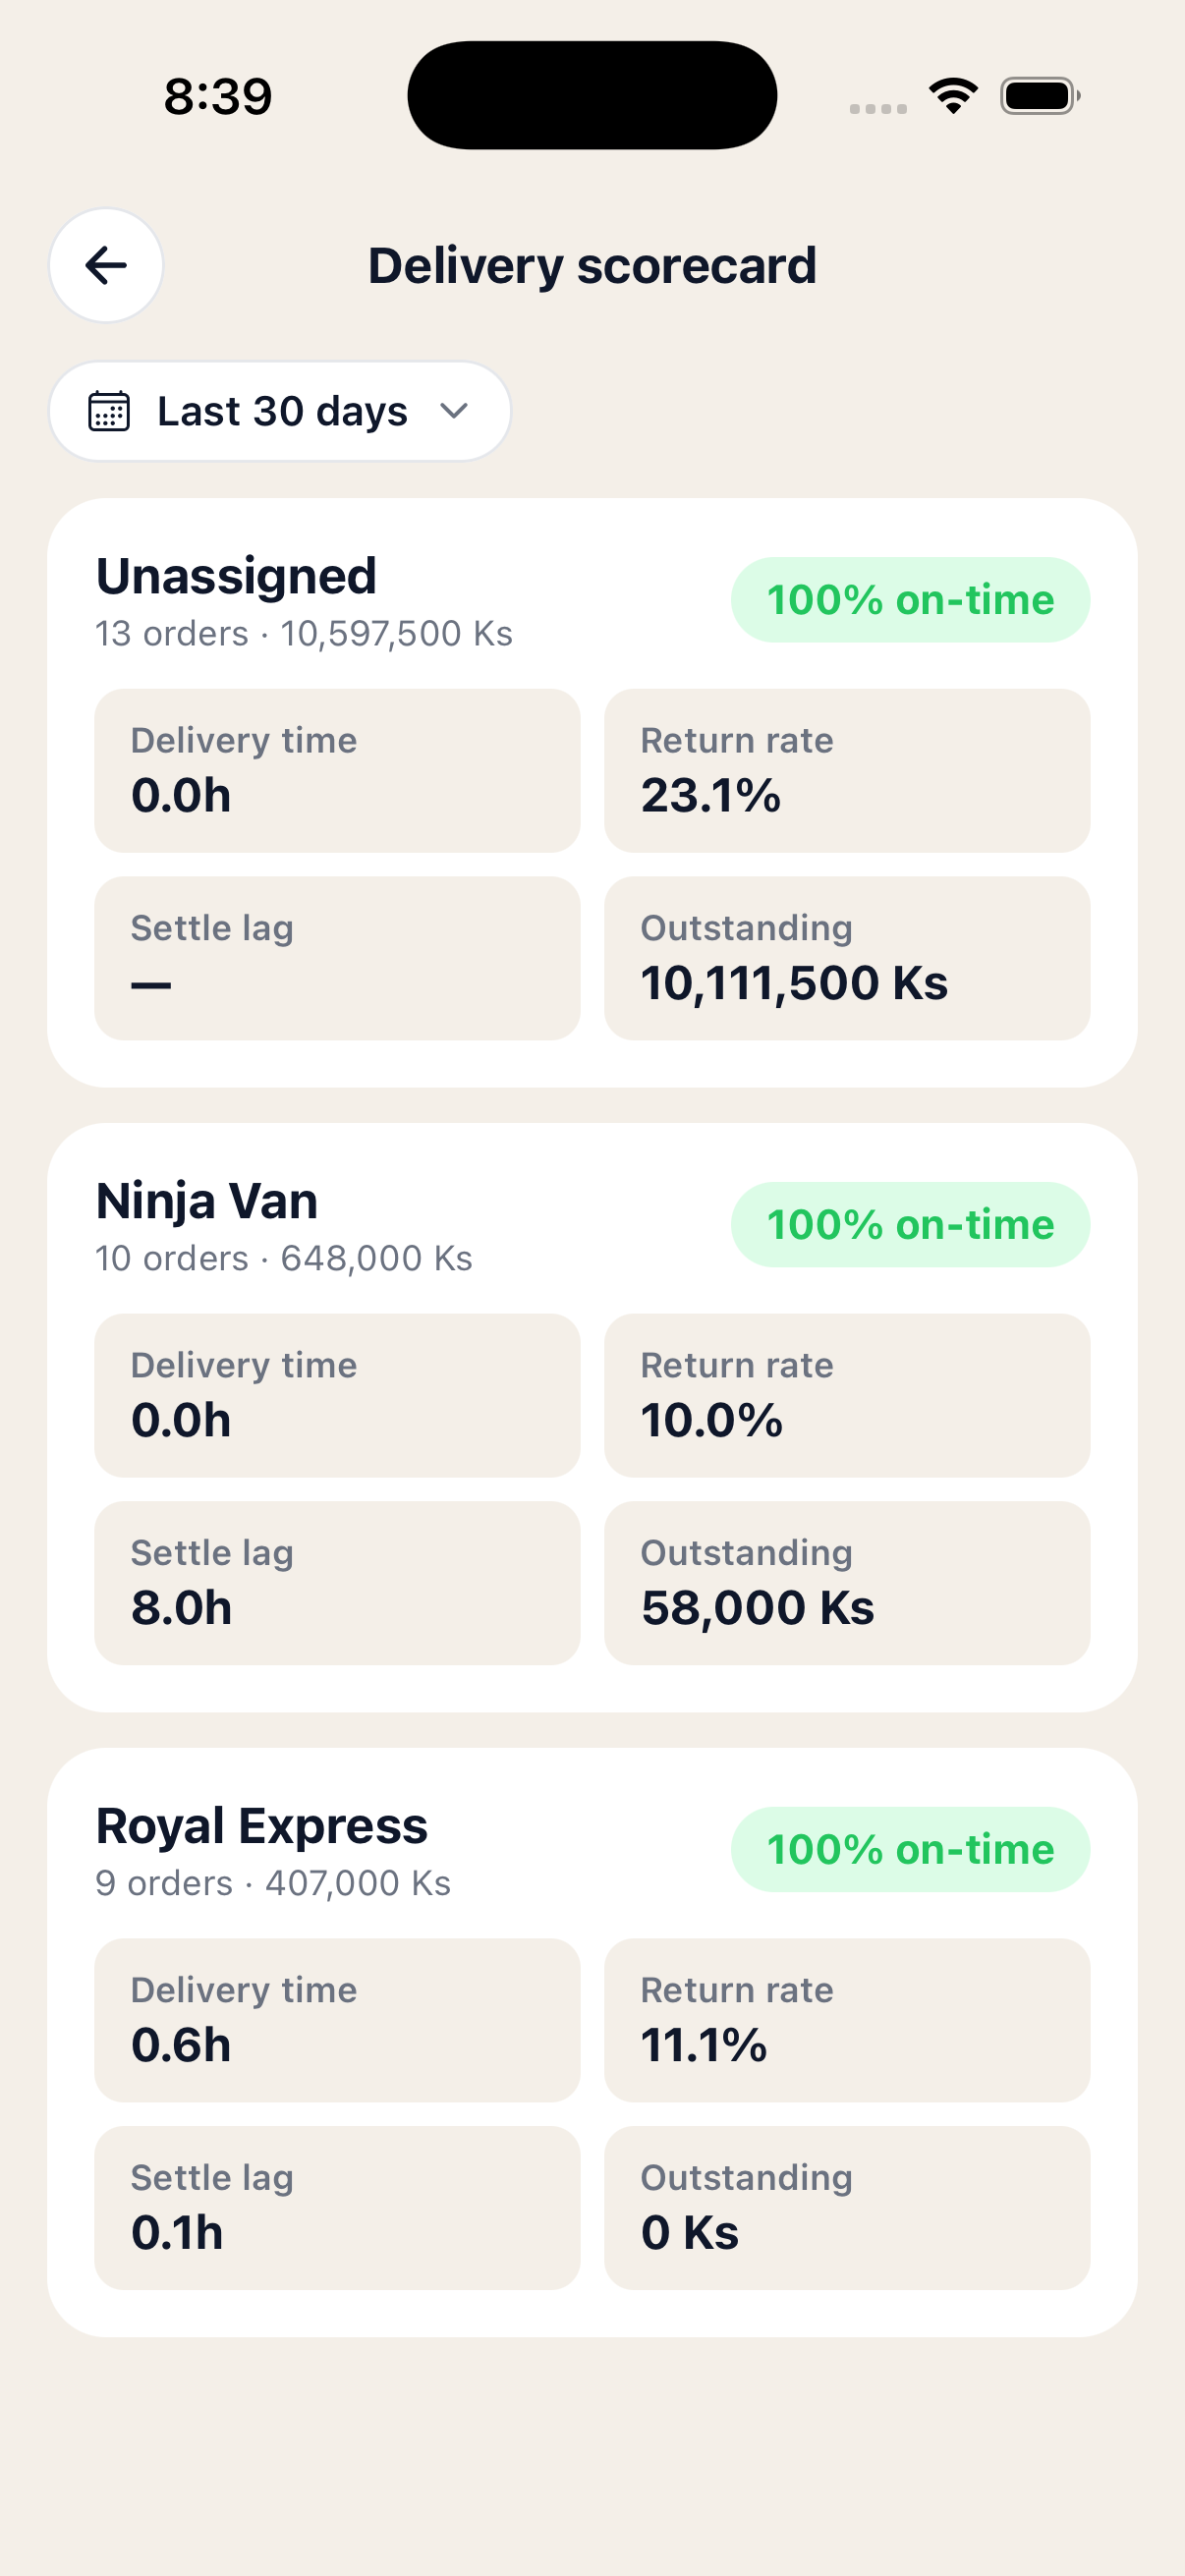 One card per courier, with on-time, return and settle stats
Customers & cohorts
The Customers screen turns your customer book into numbers.
At the top, three tiles: New, Returning, and Repeat rate — what share of buyers in this range had ordered with you before.
The Lifecycle card splits everyone into active (ordered recently) and dormant (haven't in a while), with average orders and revenue per customer just below.
The Cohort retention grid groups customers by the month they first ordered, then shows how many came back in each following month. The leftmost column is always 100% (everyone's there in month 0). The further right you can read, the stickier your business is.
At the bottom, your Top repeat customers — sorted by total spent, with how many orders they've placed and when they last bought. Tap any row to jump into their full customer profile.
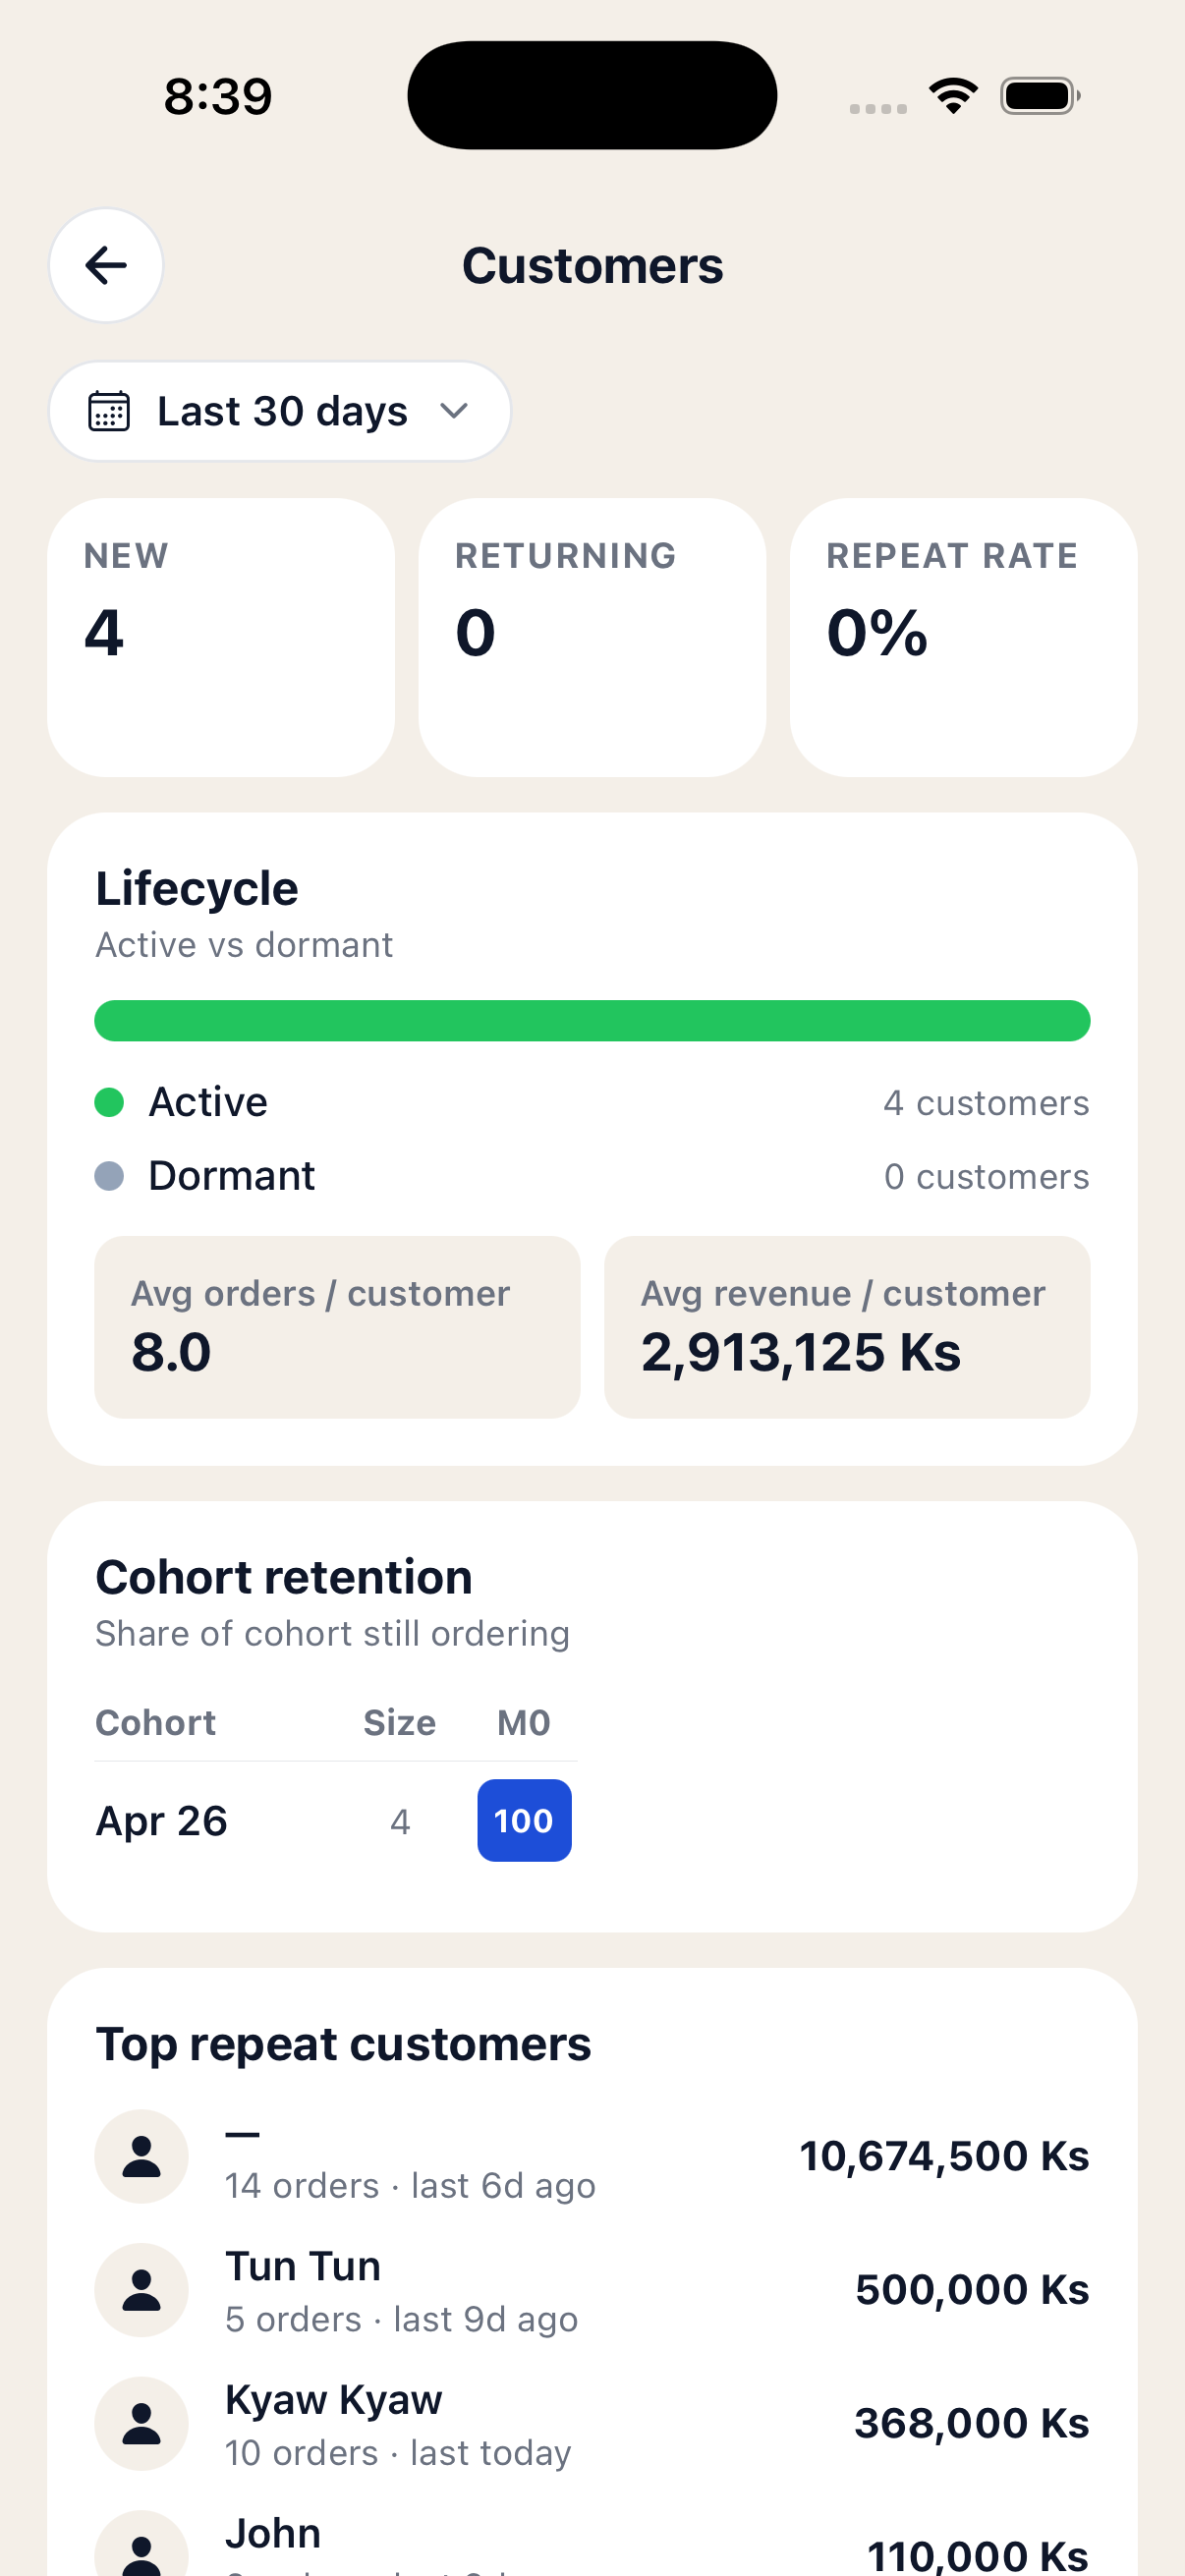 Lifecycle, cohort retention and top repeat customers
Discounts & returns
The Discounts screen shows what you gave away. The hero is your discount burn — total kyat discounted, and what share of subtotal that represents. The discounted vs full price bar shows how many orders bought at sale price vs full, and two tiles compare AOV with and without a discount — useful for telling if a promo is bringing in the right kind of order.
The daily discount chart at the bottom helps you spot if one day blew the budget.
The Returns screen is the mirror image. Three tiles up top — return rate, returned orders, refund value — then a daily returns chart. Below that:
- Top reasons — what customers (or couriers) said when the order came back. Customer not available and Customer changed mind usually lead the list.
- By payment channel & By delivery service — return rate per channel and per courier. A high number here is the clearest signal that something needs to change.
Tip: When you mark an order Returned, the optional reason you type lands here as the top reasons list. Picking a consistent vocabulary ("changed mind", "wrong size", "damaged in transit") makes this report a lot more useful over time.
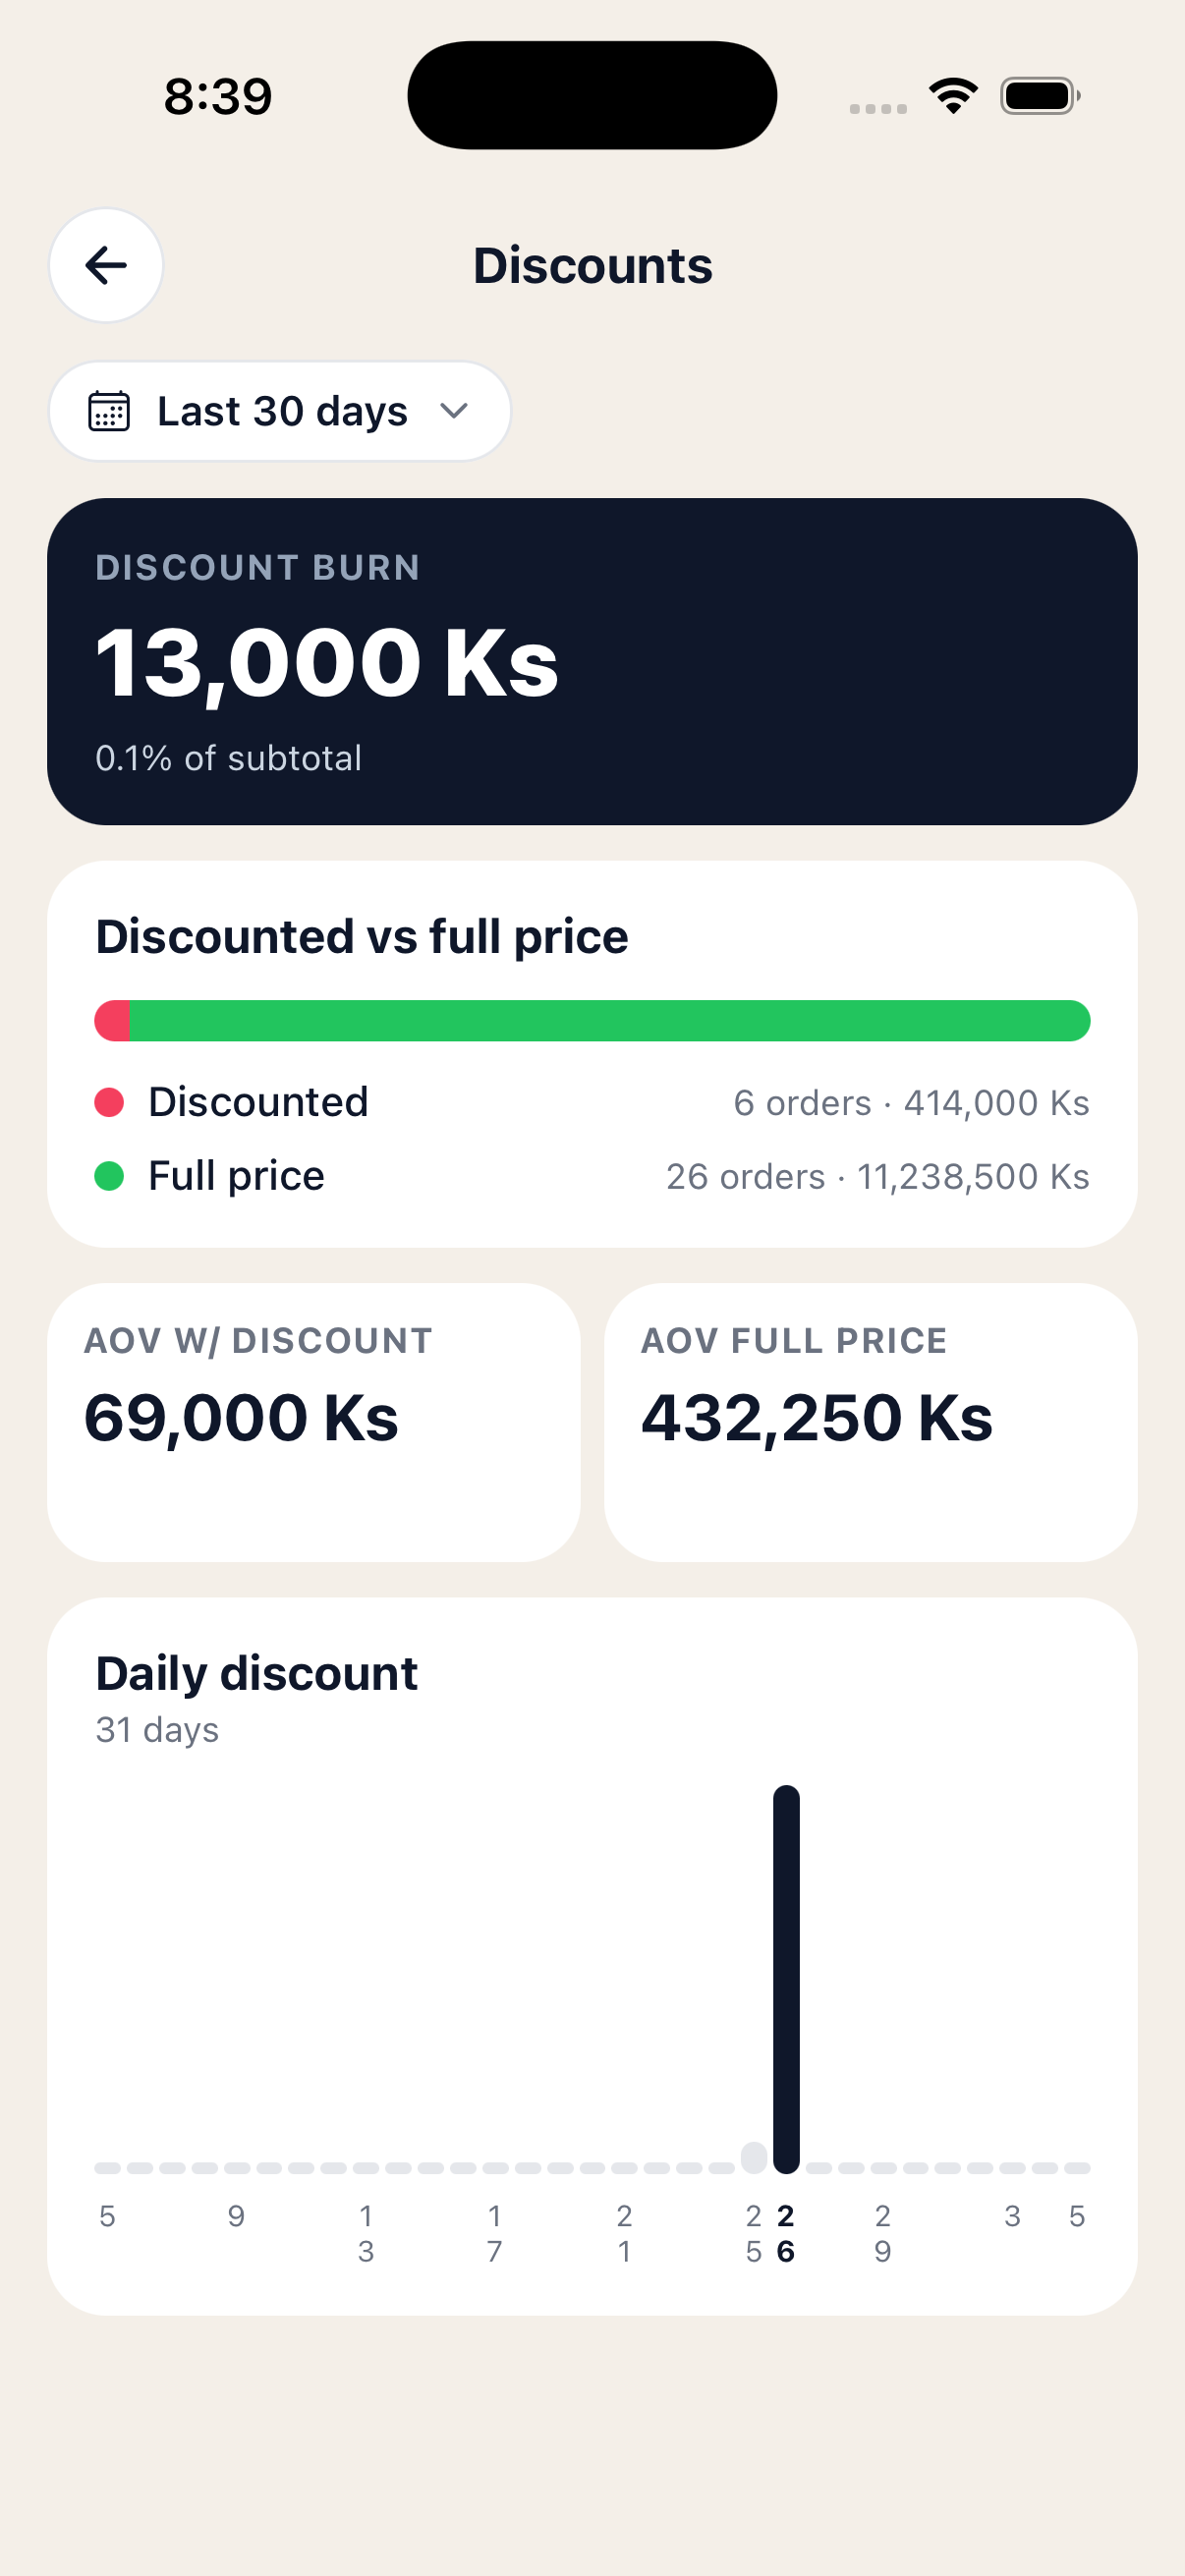 Discounts — what you gave away
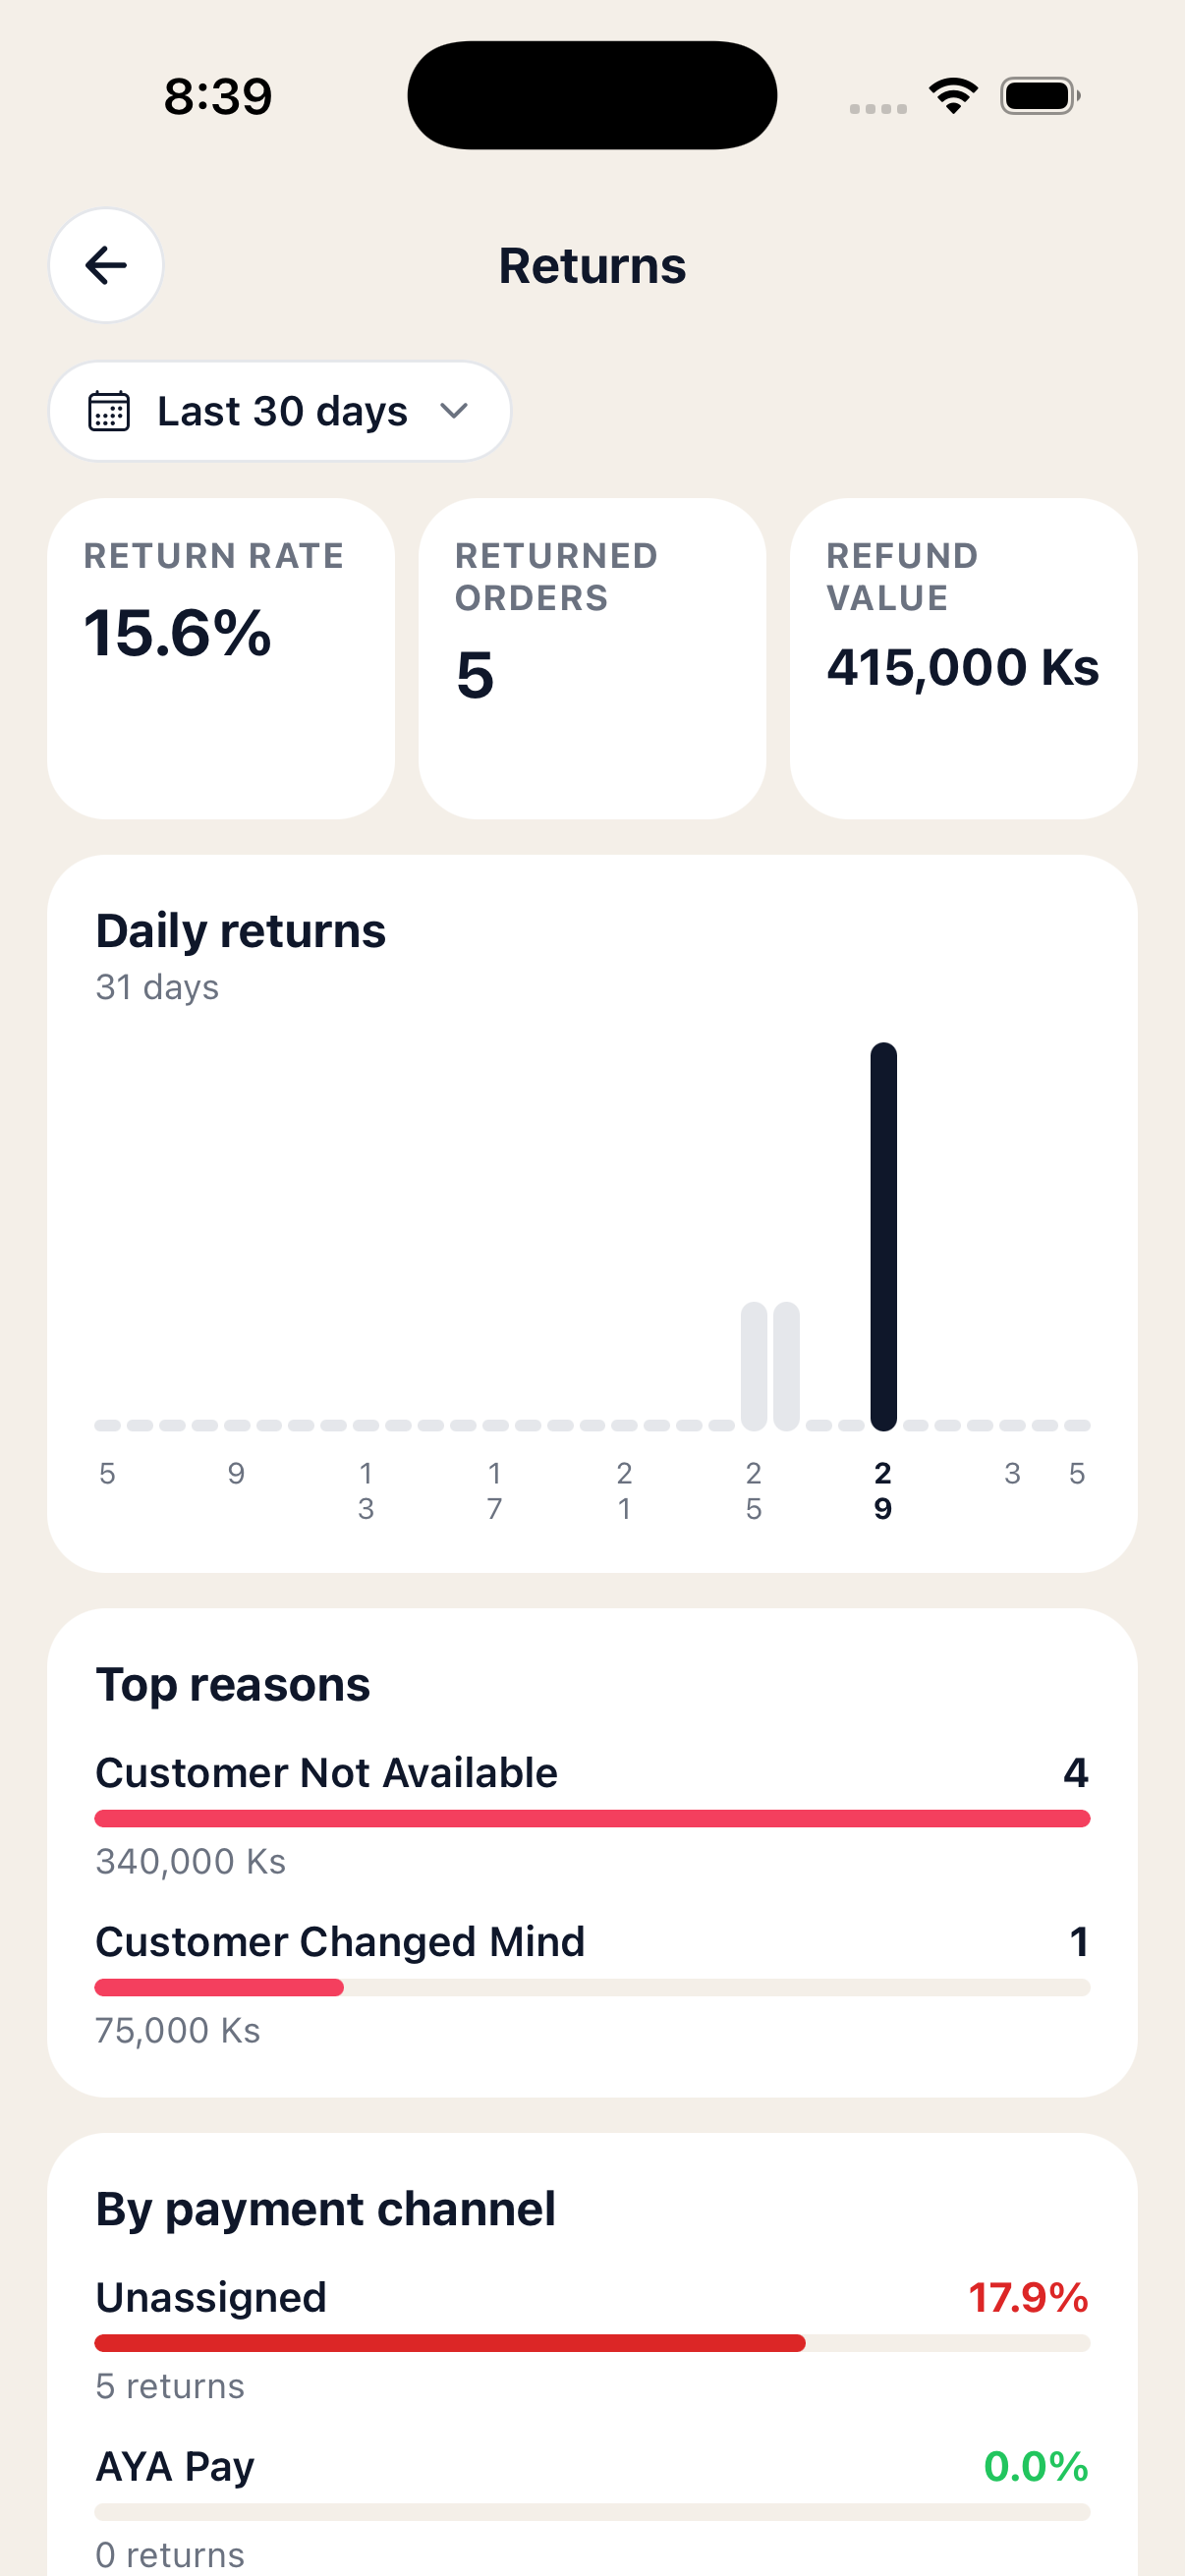 Returns — what came back, and why
Hourly heatmap
The Hourly screen answers when orders arrive. Two tiles up top — total orders and revenue — then a 7-row by 24-column grid: one row per day of the week (Sunday at the top), one column per hour from midnight to midnight.
Darker cells mean more orders. A small chip below the grid calls out your peak — the single hour-of-week that's busiest in the chosen range (e.g. Sat 4pm · 7 orders).
Hours are bucketed in UTC, so if you're in Yangon (UTC+6:30) you'll need to add about 6½ hours when reading the chart. The hint above the heatmap reminds you of this every time.
Use it to plan staffing, schedule social posts, or decide when to launch a flash sale.
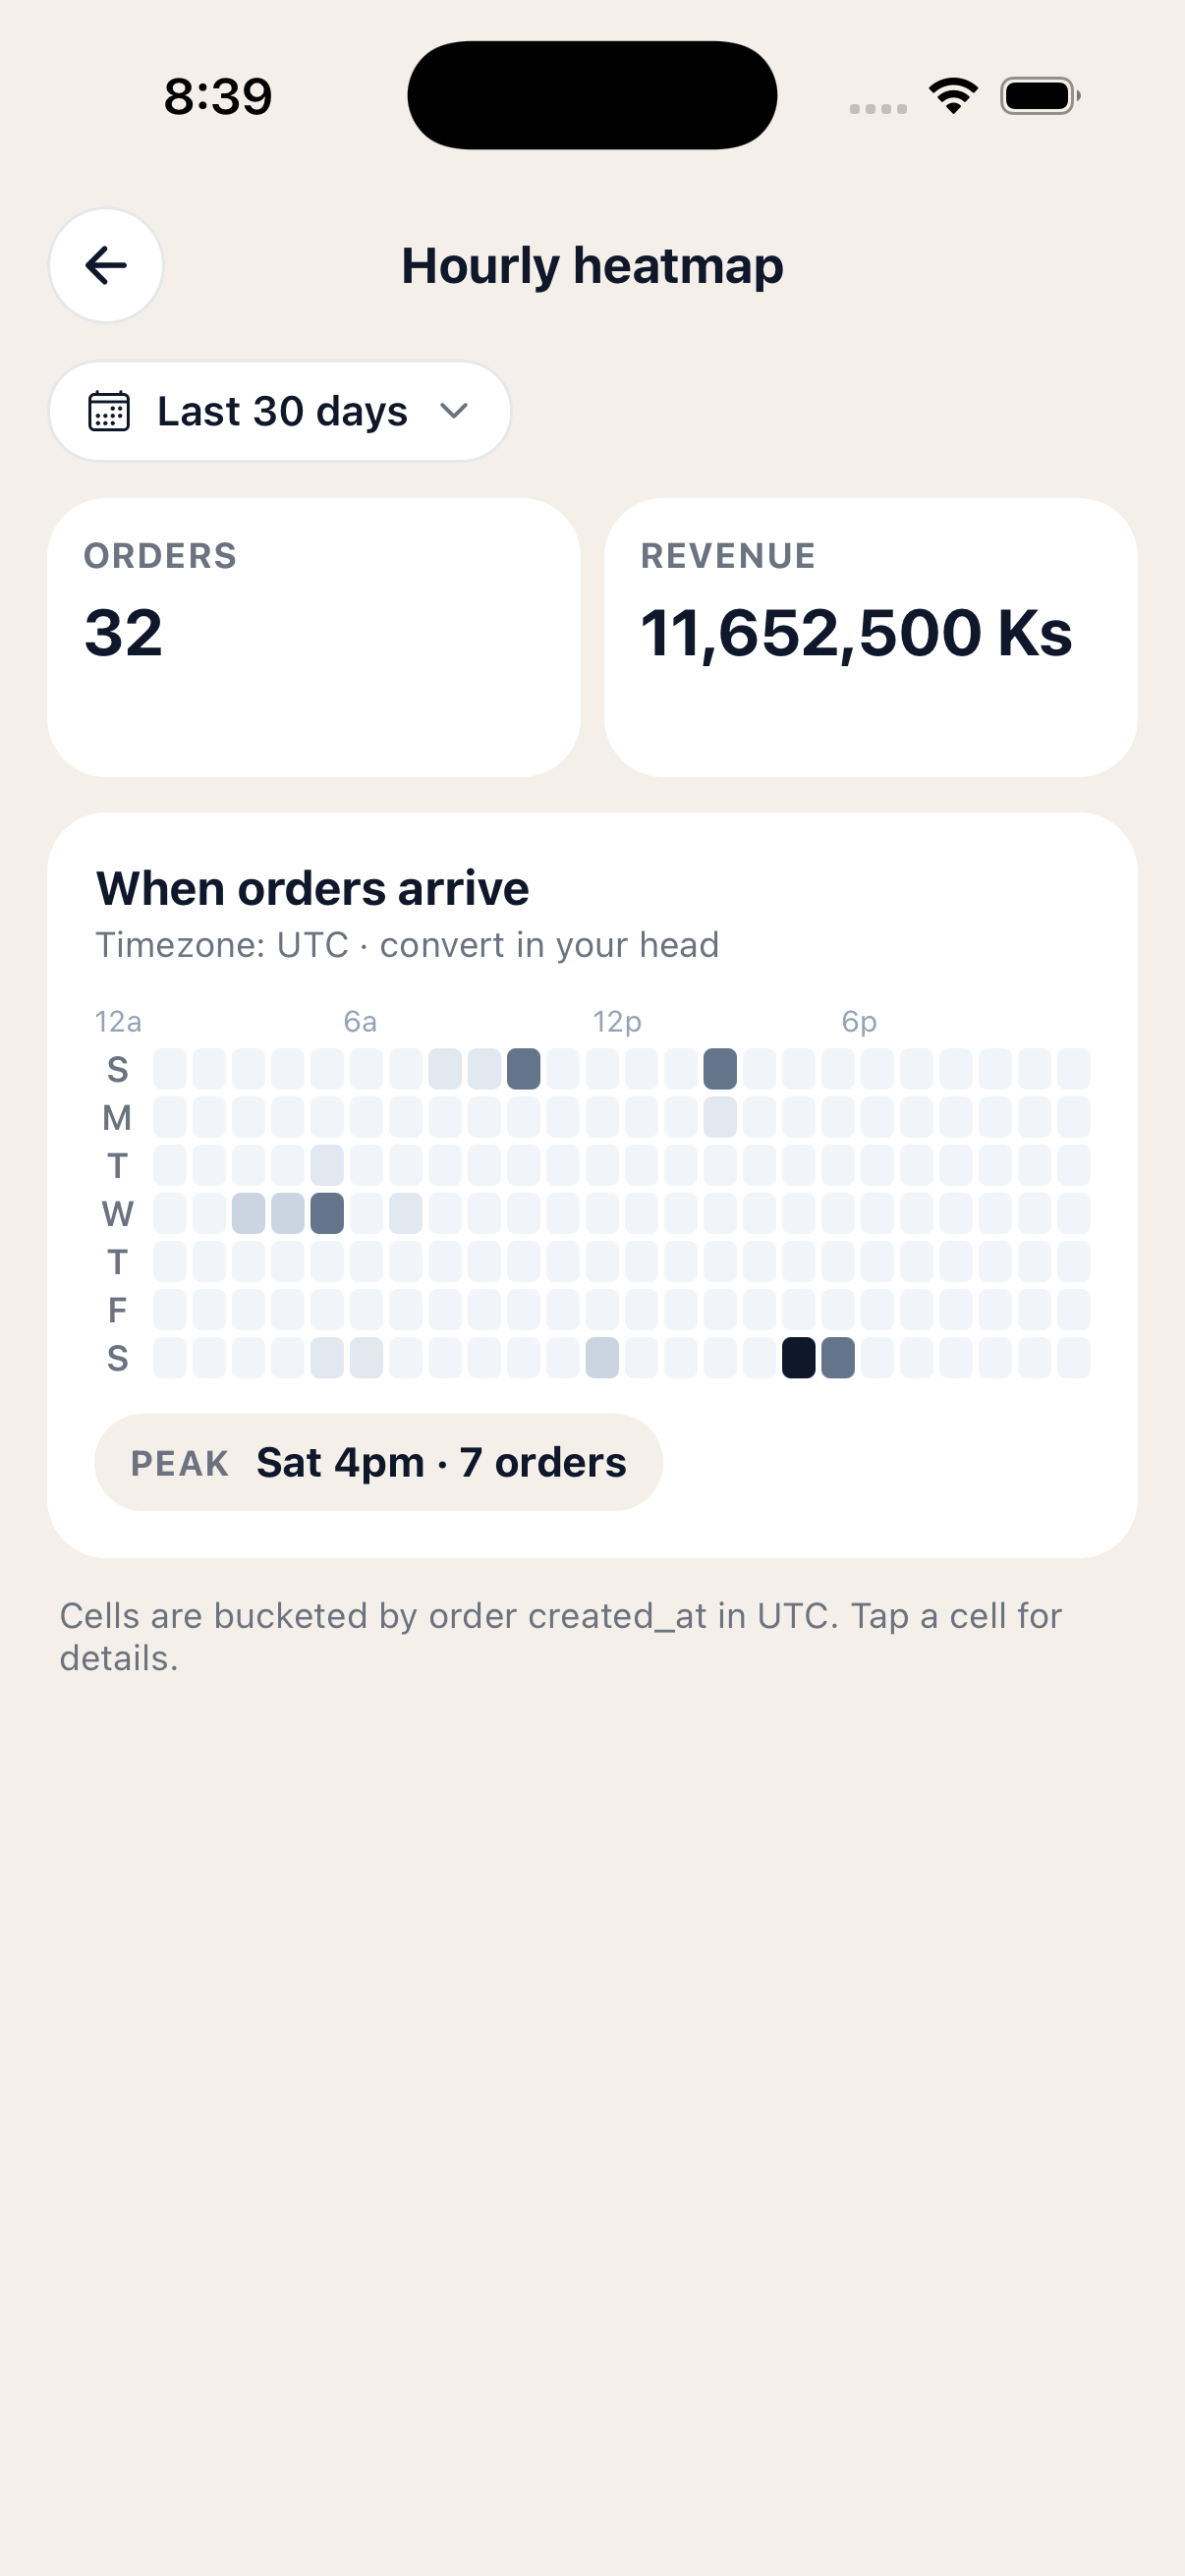 Day-of-week × hour-of-day, with the peak called out
That's it!
You can now read every report in the app — overview, P&L, cashflow, payments, delivery, customers, discounts, returns and the hourly heatmap. The numbers improve as you record more orders, restocks (with prices), expenses and return reasons. If something here doesn't match what you see in the app, message us on our Facebook page — we'll update the guide.
← Back to all tutorials